Unit 6 - Principles of qualitative analysis
6.1 - Welcome to the Unit
Welcome to Unit 6 where you will learn about the principles of qualitative data analysis (QDA). You will be introduced to the general principles of what to do with qualitative data and how to use it to answer your qualitative research question. Each step in the process is described to help you undertake QDA and be confident in the outcome. We will explore different ways data can be analysed and the decision making that takes place around suitable frameworks to facilitate QDA. Although we introduce several different analytical approaches, we focus in more detail on two approaches to Thematic Analysis (TA). Specifically, these are Framework Analysis and reflexive TA.Unit Content
→ The aim of qualitative analysis.
→ Processing qualitative data ready for analysis.
→ Core principles of QDA.
→ An introduction to framework analysis and reflexive thematic analysis.
→ Good analysis and the importance of reflexivity.
→ Qualitative software
Reflection Point
Think for a moment about what happens after data collection in a qualitative study. Would you know what to do next? What steps do you think qualitative researchers need to go through to formulate the findings of their study?
6.2 - The aim of qualitative data analysis (QDA)
Like all analysis, the aim of QDA is to process raw data into something meaningful that will have wider implications than the study population from which it was drawn. In quantitative studies, data are usually processed by adding the data to a table or spreadsheet. To identify what is important in the data, a descriptive and/or inferential statistical calculation is conducted. The aim of quantitative analysis is usually generalisation.In qualitative research, the data also need to be processed and the important aspects of the data identified; but in contrast to quantitative analysis, there are no statistical tests that do this. Furthermore, the aim of qualitative analysis is [transferability] not generalisability (see Unit Seven for a discussion of transferability). Instead of using P values to identify what is significant in the data, in QDA it is the researcher who must make decisions about what is, and is not, important within a data set.
6.3 - Planning for QDA
The approach to QDA should be determined during protocol development, and proper consideration should be given to the volume of data to be collected and the amount of time available to complete the analysis as required. There are lots of different ways to analyse data, and no one way is ‘better’ than the other. If you think back to the different philosophical approaches to qualitative research in Unit One and the continuum of qualitative research in Unit Two, you will remember that qualitative research is extremely heterogeneous; given this position, the ‘best’ qualitative analysis is that which is congruent with the philosophical underpinning of the study, its theoretical framework and its methodology. For example, if an interpretive stance is adopted, then descriptive analysis is not appropriate. And if a specific theoretically informed design is used, such as [grounded theory] or [narrative inquiry], then there are specific analytical strategies for these approaches (e.g. grounded theorists use [constant comparison], while those using narrative inquiry would normally use [narrative analysis]).However, there is some flexibility in qualitative research which allows those who have not aligned their study with specific ontological/epistemological positions, or those who have not designed their study within a specific system of inquiry, to be more flexible over their choice of QDA framework. In this sense, QDA can be seen as a ‘tool kit’ with different approaches to select for different research problems. For example, a constant comparison analysis or open and axial coding, most commonly associated with grounded theory methodology, can be used outside of a grounded theory study.
While having a robust analytical plan is particularly important, this flexibility in qualitative research means that a researcher may change their stance toward QDA during a study. For example, when an a priori analytical approach fails to yield the insights required to answer the research question, the researcher may decide to adopt a different analytical approach that will yield better insight into the phenomena under investigation.
QDA is probably the most complex element of qualitative inquiry. Those attempting qualitative analysis for the first time, or researchers proposing a particularly complex analysis, would benefit from consulting an experienced qualitative researcher in much the same way as quantitative researchers consult statisticians.
Key Points
Planning for QDA→ Plan QDA during protocol development.
→ Ensure QDA is appropriate for the philosophical/theoretical and methodological positioning of the study.
→ Be aware of the volume of data that will be collected.
→ Respect the time required for good analysis.
→ Flexibility in the qualitative research process means plans for QDA can be adapted.
→ If embarking on qualitative research for the first time, discuss analysis with a qualitative researcher.
6.4 - Data processing
Whichever way data have been collected – written, verbal, observation, or imagery – this data needs to be turned into something that can be analysed. Most typically, for oral data this starts with transcription, which is a written account of the verbal data. While this may seem straightforward, there are still decisions to make about how the transcript should look and what should be included.From a visual perspective, each document should have anonymised details of the participant, the date and time of the interview, and who was present. Margins should be wide on both sides of the text so that if printed these can be used to make notes. Alternatively, place the transcript in a table and use columns on either side. Using a large, clear font and double line spacing can also help make the transcript easier to read. Anonymity is important at the point of transcription, so be sure to change any revealing details like names and geographical locations. It may also be appropriate to change unique details (e.g. particular medical histories, places of work) which, if shared, could reveal that person’s identity. Participants can be given random or chronological number identifiers (e.g. 529 or 01, 02), or linked identifiers that use digits from postcodes and telephone numbers, for example (e.g. DE998173) – these create a link between the data and the subject, which may be needed in some studies (importantly, do not use initials or dates of birth in these codes). Alternatively, you could use random pseudonyms (e.g. John, Mohamed, Olumide).
From a content perspective, a decision needs to be made about what will be transcribed – for example, non-verbal expressions, emotional responses, pauses, utterances, stutters. In addition, should the transcript be written to capture phonetical spelling and local dialect? These need to be consistent throughout a study, so decisions need to be taken at the outset. In this regard, many qualitative researchers will use ‘verbatim transcription’, which captures everything that occurred during the interview. Verbatim transcription is intensive, it is not uncommon for a one hour interview to take eight hours of transcription. In contrast, intelligent verbatim transcription will moderate what is transcribed in favour of the main verbal exchange, but not the more subtle cues that exist around it. Intelligent verbatim transcription can be quicker for studies, but it can result in data loss, so researchers should consider the potential impact on their ability to address the aim of their study. If time is limited in a study, and there are funds available, consider using a transcription service – or consider using transcription software, which may be free or have an associated licence fee. Always remember to check compliance to relevant privacy and data protection laws before sharing your data with a transcription service or transcription software. The researcher may, of course, want to transcribe the data themselves, as this has many benefits. If researcher transcription is preferred, there is equipment that can make this process easier, such as foot pedals for moving backwards and forwards in the audio file, which leaves your hands free to type.
If the data is already in a written form, e.g. emails, blogs, online chat, this makes data processing easier. However, there are still decisions about presentation of raw data, anonymity, and recording contextual details such as dates, times, location etc.
Key Points
Data processing→ All data needs to be turned into something that can be analysed.
→ Audio files are transcribed prior to QDA.
→ During transcription, make sure data are anonymised – change names, people, places and any information that is unique and could reveal the participant’s identity.
→ Transcripts should be easy to read and prepared for analysis (e.g. large, clear font; double line spacing; wide margins or columns).
→ Decide what to transcribe and consider the impact of any data loss to the aim of the study.
→ Consider the use of transcription services or software, but always check compliance to relevant data protection laws.
6.5 - Data reduction
The large amount of data that can be generated in a relatively small qualitative study can be overwhelming. A one-hour interview, for example, can produce a written account of over 50 pages. Therefore, the aim of all analysis is to reduce the data down to something more manageable without losing the meaning or context of the data. This is facilitated through QDA procedures where researchers are trying to find some commonality or pattern within the data set. These commonalities can be clustered together into categories, sometimes known as themes, which represent participants’ shared account in a way that is honest, meaningful, and respectful to their contribution. The resultant themes illustrate the problem under investigation and sometimes the solutions as well.6.6 - Getting to know your data
Many authors would argue that transcription is the first stage in analysis, because this is where the researcher gets to know their data well: a process called [‘immersion’]. During this phase, you should first take a broad overview of what the participant is trying to say. Then, go back to the data and look at it in a microscopic way, thinking more about ‘what else could they be saying here?’ Transcription is a great way to spend time with the data and really get to know it. Therefore, if the research team chooses to outsource transcription, immersion needs to happen in a different way, such as listening to audio files several times or reading transcripts several times prior to making any firm decisions about what may or may not be important in the data. Of course, the level of immersion will depend on the research question and the type of data collected. Some QDA stays at a surface level to describe the data; other QDA may look for meaning in what was said as well as what was not said.Key Points
Getting to know the data→ Read and re-read the written data.
→ Listen and re-listen to audio files.
→ Think and reflect on what may be important in the data before making any firm decisions
6.7 - Beginning to label the data
After transcription and immersion, the researcher is often required to break down the pages of raw data by locating the information that will help them answer their research questions. A common way to work with the data in this way is to highlight and label relevant text in the transcript. This labelling of the data is usually (but not always) referred to as coding.“a code is a word or brief phrase that captures the essence of why you think a particular bit of data may be useful” 1 (p.207)
“Codes are tags or labels for assigning units of meaning to the descriptive or inferential information compiled during a study. Codes usually are attached to ‘chunks’ of varying size-words, phrases, sentences, or whole paragraphs, connected or unconnected to a specific setting. They can take the form of a straightforward category label or a more complex one (e.g. metaphor).” 2 (p.56)
Coding decisions can be deductive, inductive or both. In deductive coding, the research team will have an a priori framework (also known as a coding book) of what they want to identify in the data. In an inductive approach, the research team may want to be led by the data and have no a priori assumptions about what they want to find out, so they develop the coding book as they analyse their data. Depending on the qualitative methodology being used, codes can be fixed, i.e. once decided upon, the code does not change in response to the data; by contrast, coding can also be fluid, where codes evolve during analysis. This latter approach reflects a more iterative process as new information is uncovered and new understanding about the data is reached.
If not being led by a coding book from the outset, knowing what to code and what not to code can be difficult. There are also no rules in QDA that says a 20-word sentence should be reduced to two codes, for example. However, code too much and you risk drowning the data; code too little and you risk a superficial analysis where much of the contextual data is omitted. Miles and Huberman2 suggests using the research question as an anchor and coding data that appear relevant to it. This approach provides some parameters for decisions about what to code and what not to code without expanding into areas that may not be relevant to your research. Other approaches, like in grounded theory, will code everything without making early assumptions about what may or may not be relevant. This way the researchers stay open to analysis which is grounded in the data and not led by the assumptions of the researchers.
A useful strategy during QDA can be to code with another researcher. In some designs, more aligned to post-positivist assumptions (e.g. content analysis), coding with another researcher is to confirm the accuracy of coding decisions between the team of researchers. Researchers may even report this as ‘inter-rater reliability’. However, aligning with more relativist ontology this process of coding with another researcher is more about advancing analysis and interpretation rather than checking coding decisions are correct. For novice, and experienced researchers, analysing with others is an enjoyable part of the process, offering time to reflect and think, while also adding rigour to the analytical process.
Coding decisions will depend on the methodology; however, most commonly these will include a mix of descriptive and interpretive codes. Descriptive codes (sometimes called data-derived, manifest or semantic codes) label exactly what can be identified and provide a useful summary of the explicit content of the data. In descriptive coding, the researcher maintains distance and separation from the objects of study – a position far more obviously associated with a post-positivist philosophy. In contrast, interpretive codes (sometimes called latent or researcher derived) go beyond the data through the application of conceptual and theoretical frameworks to examine implied meaning, which may be hidden deep within the data set.3 For example, not wearing a seat belt could be descriptively coded as ‘not wearing a seat belt’ or could be interpretively coded as ‘risk-taking behaviour’. If latent coding is being used the researcher needs to consider why they are interpreting the meaning in this way and if there are other ways to view these experiences.
Figure 6.1 shows a short extract of coding from a qualitative study about road safety. This extract demonstrates how different colours are used to code the different sections of the transcript. It important to say that the text that is not highlighted does not indicate this information is unimportant/redundant. Researchers should return to such areas regularly and check if this contextual information helps to aid interpretation.
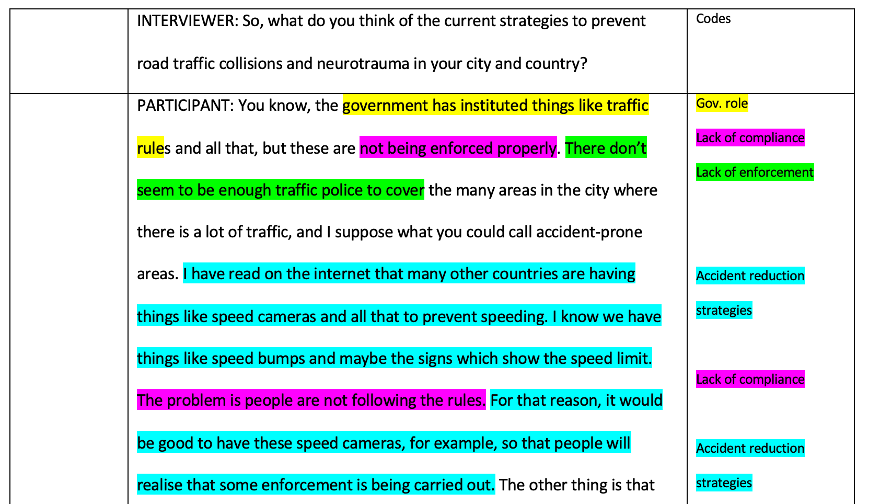 Figure 6.1: Example of coded transcript.
Key Points
Beginning to code→ Coding is a process of labelling important parts of the data set.
→ Coding decisions can be made a priori or in response to the data.
→ Codes can be fixed or fluid.
→ Coding can be facilitated with the help of another researcher.
→ Codes can be descriptive or interpretive, or a mix of both.
6.8 - Findings from QDA
After working with the data through close interrogation, researchers must move towards their findings. Findings will look different depending on the type of qualitative research being conducted. Themes and sub-themes are probably the most commonly reported product of QDA; however, there are others.In order to create themes, the researchers must work with their codes and cluster these into groups of codes that are similar. In an iterative approach to the theme development codes may move in and out of clusters as the researcher begins to understand their meaning in more depth. The researcher will then work with the clusters of codes bringing similar clusters together to build categories. Once again, clusters may move in and out of categories as the researcher develops more confidence about how the data should be described or interpreted until a hierarchy is reached that is more stable and representative of the whole data set. The overarching categories are then identified as themes and the clusters of codes within them are usually called sub-themes. Each needs to be given a careful name that represents the data stored within it. Themes can be independent of each other or inter-related, the researcher will need to explain the relationships and boundaries associated with each theme during the writing-up phase.
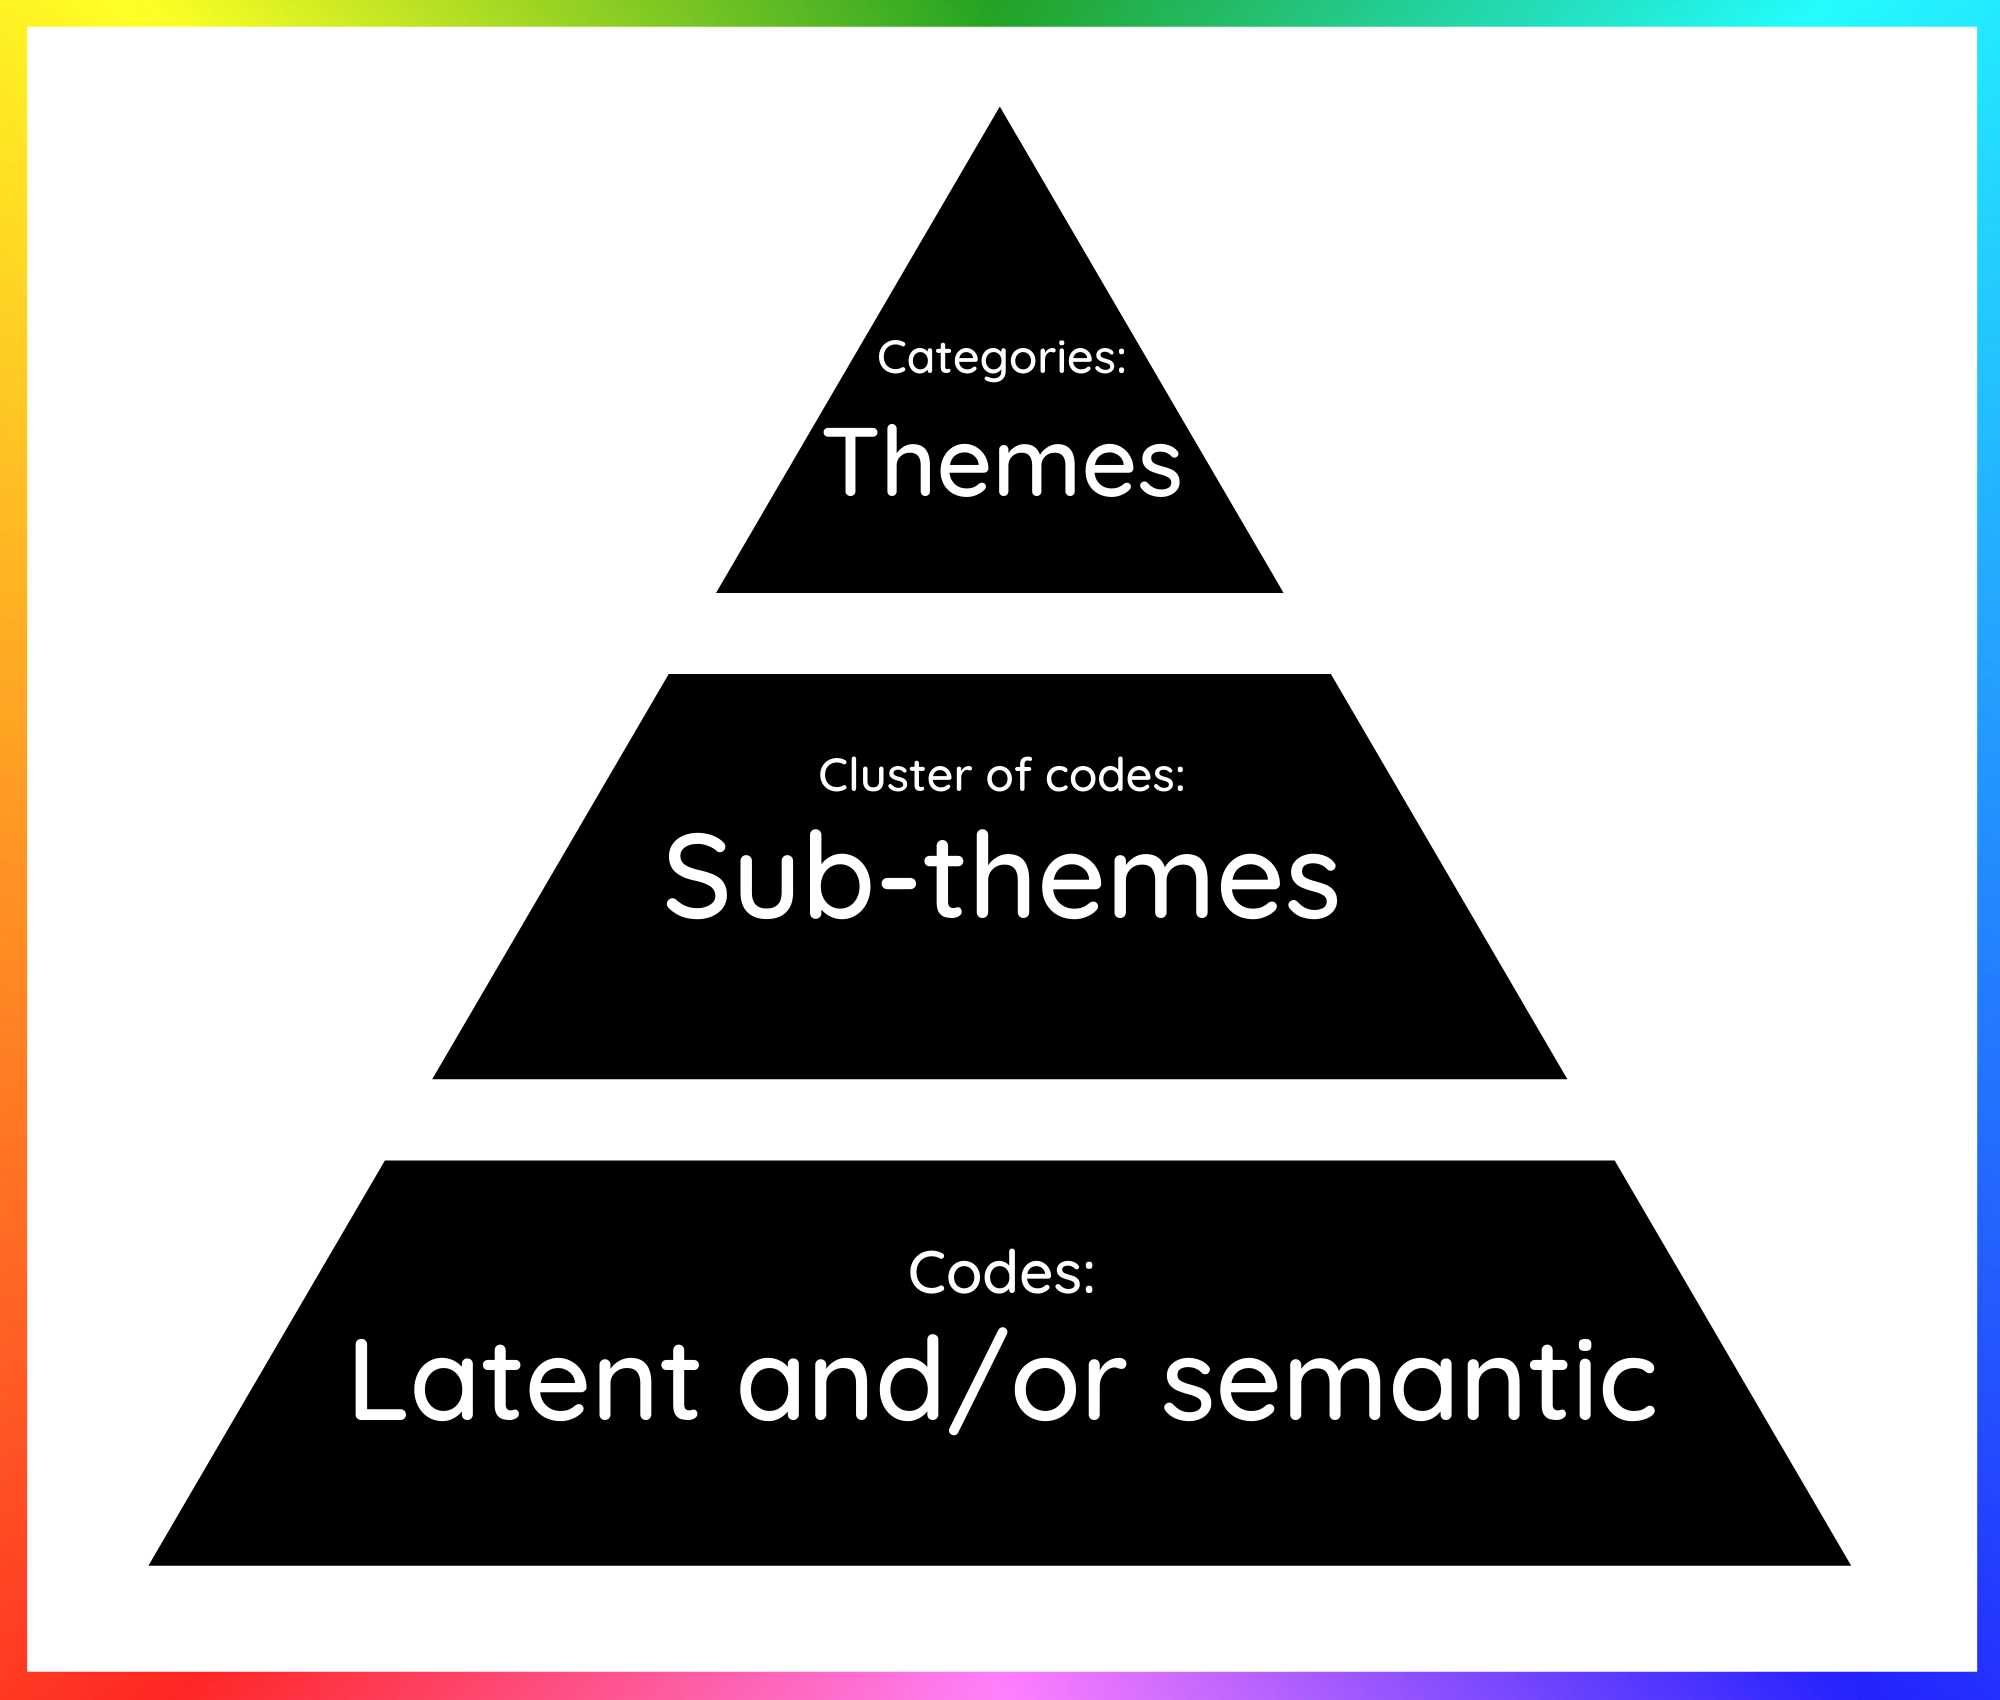 Figure 6.2: Example of a typical hierarchical relationship between codes, sub-themes and themes.
It is worth remembering that themes and sub-themes are not the only possible format for qualitative findings. Depending on the methodology there are other ways findings can be reported. For example, in classical grounded theory,4 themes and sub-themes will be scrutinised for a substantive theory that can explain the whole data set. This theory may be displayed as a diagram or illustration of how the themes interact.
In contrast, in narrative inquiry, the analysis is less dependent on coding procedures, and thinks more holistically about the form and content of the story being told. The product of analysis may be storylines or narratives. For example, in a study by Brown and Addington-Hall 20075, who explored how people with motor Neuron Disease talked about living with their illness, the findings were presented as four storylines: sustaining; enduring; survival; and fracturing. While Whiffin et al.6 explored the experiences of families after traumatic brain injury in the first year and presented five interwoven narratives: trauma, recovery, autobiographical, suffering and family. These examples show a different approach to the popular themes and sub-themes responding to a need for more individual interpretation of these experiences.
Key Points
Developing themes→ Themes are the most common product of QDA studies.
→ Codes are clustered into related groups.
→ Clusters of codes are then used to build broader categories.
→ Categories become themes, clusters of codes become sub-themes and these are assigned appropriate names.
→ Themes can be independent of each other or interrelated.
→ Any relationships need to be explained in the write-up of the findings.
| Recommended reading: |
|---|
| The coding manual for qualitative researchers by Saldaña.7 |
| Interpreting qualitative data by Silverman. 8 |
6.9 - Analytical frameworks for QDA
Prior to this section we examined general principles of QDA. Now we will consider more specific approaches to QDA. Table 6.1 outlines some of the most common QDA techniques. Some are very prescriptive and rigid to follow, giving the researcher more scaffolding around their analysis. Others are less so, allowing the researcher to adopt a more immersive and open approach.| QDA technique | Description |
|---|---|
| Content analysis | Examines the frequency of codes; the emphasis is on what can be explicitly identified in the data, rather than what may be implied. |
| Framework | Starts with a deductive stage mapping data against an a priori framework. An inductive stage follows and data that does not map to the original framework is examined. |
| Reflexive thematic analysis | A six-stage interpretive process, developed by Braun and Clarke9,10 to identify themes in the data. |
| Constant comparison, open and axial coding. | Origins in grounded theory but can be used outside this methodology. Very detailed analysis breaking the data apart, rebuilding and locating theory where appropriate. |
| Interpretive phenomenological analysis | A specific branch of interpretive phenomenology using a protocol-led process (see Smith et al.11). |
| Discourse analysis | Analysis of language, based on examining the frequency of data items and the application of an interpretive approach to make sense of what the data items mean. |
| Within and between case analysis | Typical in case study research: comprehensive analysis of multiple forms of data within a ‘bounded system’ (i.e. ‘the case’) then there can be a comparison of data between different bounded systems (i.e. the cases). |
| Narrative analysis | Analysis of the ‘storied’ account with an emphasis on temporality (i.e. past, present and future). |
Table 6.1: Different approaches to QDA.
In this unit, we wanted to describe in more detail two QDA techniques commonly seen in the literature. Specifically, these are: framework analysis, and reflexive thematic analysis. Both of which lie outside of specific systems of inquiry like phenomenology, narrative or grounded theory, and can be used to address a range of different qualitative research questions.
6.10 - Framework Analysis
If we use the analogy of Big Q and small q introduced in Unit 1, framework analysis might be considered smaller q because it favours a deductive technique often with an a priori framework and does not always fully engage with the interpretive philosophy that is the hallmark of Big Q studies. In fact, Braun and Clarke12 actually label such code book approaches as ‘medium Q’ because of their commitment to qualitative values despite the more rigid approach to coding.Framework analysis is a very useful approach if the researchers have a fair idea of what it is they are interested in within the data and want to know in what way, and perhaps how often, these concepts arise. When data sets are large, time is limited and a team of researchers are working on the data framework analysis can be a good choice of analytical approach.
Table 6.2 describes two different approaches to framework analysis. A seven stage process by Gale et al.8and a five stage process by Ritchie and Spencer.9
| Framework analysis by Gale et al.13 | Framework analysis by Ritchie and Spencer.14 | |
|---|---|---|
| 1) Transcription (verbatim) 2) Familiarisation with the interview 3) Coding 4) Developing a working analytical framework 5) Applying the analytical framework* 6) Charting the data into the framework matrix 7) Interpreting the data *An analytical framework is a set of codes organised into categories that are used to manage and organise the data. |
1) Familiarisation 2) Identifying a thematic framework 3) Indexing and sorting 4) Charting 5) Mapping and Interpretation |
Table 6.2: Two approaches to framework analysis.
For an example of framework analysis using Gale et al.'s13 method see Selveindran et al.15 who used this approach to examine the prevention of road traffic collisions and associated neurotrauma in Colombia from the perspectives of key informants.
6.11 - Reflexive Thematic Analysis (rTA)
By contrast reflexive Thematic Analysis (rTA) is regarded as ‘Big Q’ because it is committed to reflexive interpretive analysis despite not having specific ontological and epistemological anchors.16 Reflexive Thematic Analysis (rTA) is a flexible version of thematic analysis and is a very popular choice for qualitative researchers. There are six stages in rTA: familiarising yourself with the dataset; coding; generating initial themes; developing and reviewing themes; refining, defining and naming themes; writing up.12 You can see in Table 6.3 how these were applied to a study that aimed to understand the contextual challenges associated with long- term follow- up of patients following traumatic brain injury in Low-and middle-income countries.17
| Phase | Description | Product of framework |
|---|---|---|
| 1) Familiarising yourself with the dataset | Transcription of data, reading and re-reading data, taking note of initial ideas and keeping a reflexive diary. | Preliminary codes. |
| 2) Coding | Systemically coding interesting features of the data across the dataset, collating data relevant to each code, and creating relevant memos as to the meaning behind each code. | Comprehensive coding. |
| 3) Generating initial themes | Collating codes into potential early categories and exploring hierarchies and possible relationships between these, with critical discussion with second author. | Raw, potential ‘precursor themes’. |
| 4) Developing and reviewing themes | Checking if the themes work with relation to the coded extracts, and further with the entire dataset, followed by generating a thematic map of the analysis, with further critical discussion with second author. | Themes and an early map of the potential relationships and flow between themes. |
| 5) Refining, defining and naming themes | Ongoing analysis and revisiting and refining specifics of each theme, the overall narrative being portrayed from the analysis, and generating firm names and definitions for each theme with second author. | Refined themes and a uniting narrative. |
| 6) Writing up | Selection of vivid, compelling extract examples and a final opportunity for analysis, relating the analysis to the initial research question and literature in the production of a first report. Respondent validation and co-author feedback advanced and finalised the final report. | Comprehensive report of all themes,interpretations, and accompanying narrative supported by quotes. |
Table 6.3:Six phases of reflexive thematic analysis as applied in Smith et al.17
Key Points
Analytical frameworks for QDA→ There are several different frameworks to facilitate QDA
→ Frameworks help the researcher to move systematically from data processing to final write-up.
→ Techniques range from the highly descriptive (e.g. content analysis) to the highly interpretive (e.g. interpretive phenomenological analysis)
Reflection Point
6.12 - Reflexivity
Unlike quantitative analysis, QDA has no formula to identify what is, and what is not, important in the data. This means there is a ‘human factor’ to the analysis when making decisions about the data. The values, preferences and experiences of the researcher (known as axiology) are therefore central to all QDA procedures. Good QDA takes time and commitment to reflexivity. Mason18p.188 wrote, ‘You must satisfy yourself and others that you have not invented or misrepresented your data, or been careless and slipshod in your recording and analysis of data’.
Reflexivity in QDA is defined as:
“active acknowledgement by the researcher that his/her own actions and decisions will inevitably impact on the meaning and context of the experience under investigation”19 (p.308)
“The process of critical self-reflection about oneself as researcher (own biases, preferences, preconceptions), and the research relationship (relationship to the respondent, and how the relationship affects participant’s answers to questions” 20 (p.121)
If you adopt a post-positivist approach to QDA, the value of reflexivity may not seem obvious. However, in interpretive approaches reflexivity is key to QDA. For many researchers, instead of trying to minimise the influence of the researcher through the methods being used or to put aside all their assumptions (called bracketing), there is now more emphasis on being consciously aware of how these may be affecting the whole research process, and analysis in particular.21 Reflexivity is not just thinking about events and circumstances; instead, it demands that we question our own values, thought processes, assumptions and attitudes and how these influence our complex roles and relationships with others.22
The most common strategy to facilitate reflexivity is the maintenance of a reflexive journal. In the journal, the researcher critically explores their axiology and how their axiology is influencing the study. In the QDA phase, the researcher can also use the diary to posit ideas about relationships between codes or ideas they have for themes and sub-themes. It is very easy in qualitative research to make assumptions very quickly, so it is important to look at the data very closely. It is helpful to write down initial assumptions of the things that are going on in the data and challenge yourself to see if you are right in these assumptions, or if it’s possible that you could have misinterpreted something.
Reflexive diaries are also good for drawing or mapping out ideas about the data and what relationships may exist between these. These drawings may prove useful later on as a way to represent your data beyond the written word. They may also help advance beyond the themes into more abstract conceptualisations or theories about the phenomenon of interest. See Figure 3 for an example extract from a reflexive diary.
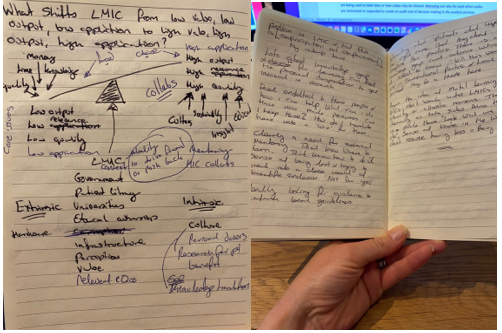
Figure 6.3: Illustration of a reflexive diary.
In addition to reflexive diaries, memoing is another reflexive technique used during QDA. Memoing has its origins in grounded theory but can be used in other approaches to QDA. Memoing is a process of making notes about what is being learnt about the data during analysis, how codes are being used to label data, or how codes may be related. Memoing can also be used when codes are contracted or expanded to create a record of decisions made in the analytical process.
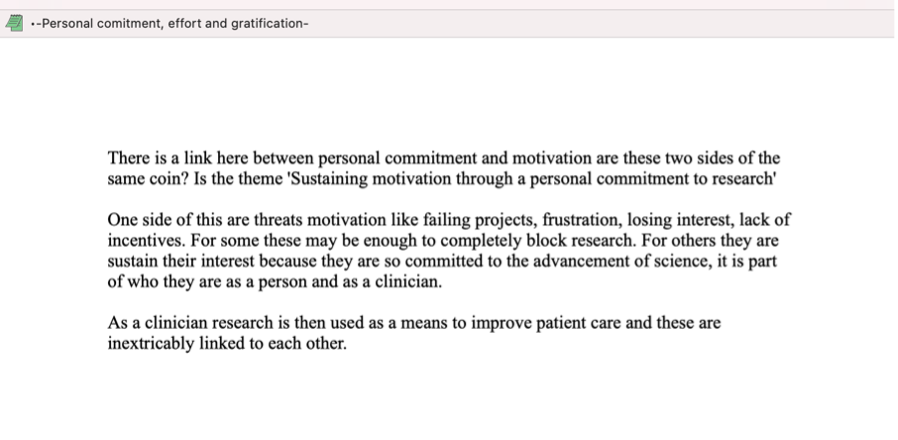 Figure 6.4: Illustration of a memo in NVivo.
Reflection Point
What do you think to the diary extracts and memos presented above? How might these help a researcher?
Key Points
Reflexivity in QDA→ QDA is an active process.
→ QDA requires conscious awareness of the influence the researcher has on the research.
→ Researchers should keep a reflexive journal.
→ Memoing is commonly used to make notes about specific areas of learning during the analysis process.
→ Active reflexivity helps to creates an audit trail of decision making.
6.13 - Analysis software
Computer software such as AtlasTI, NVivo and Quirkos can support QDA. However, it is important to be clear that this software will not analyse the data for you; it merely facilitates the analytical process and is a useful way to store data, log coding decisions, write reflections and create memos all in one place. If used well, the resulting audit trail from data to findings is a significant benefit for qualitative researchers. However, there are those who argue that using computer software separates the researcher from the data, and that this impedes immersion and limits the interpretive analysis. Such researchers often prefer a more ‘traditional’ and ‘hands on’ interaction with the data using strategies like highlighter pens, Post-it notes, and handwritten visual displays such as mind maps. Any decision to use or not use QDA software should be carefully considered. If you do choose to use QDA it is highly recommended that you attend training on the software before embarking on formal analysis (see this YouTube link for videos on NVivo).Access to software is usually through a licence and so has cost implications; however, you may find you have access via your institution. If you need a licence, you may want to build the cost into a research budget if you can.
6.14 - Unit summary
In this unit, we examined how to turn data into findings and how to use a range of QDA techniques and methods. Reflecting the heterogeneity in the qualitative field, there is no one-size-fits-all approach to QDA. Instead, researchers must select an appropriate way to analyse their data that is appropriate for their philosophical, theoretical and/or methodological position. All data must be processed and reduced down to a useable product of research. Most commonly, findings are reported as themes which summarise the meaning of the data set. To arrive at findings, the data must be broken down through coding procedures (or similar) and then rebuilt into something more useable and meaningful. Given the substantial influence of the ‘human factor’, researchers should understand how they are shaping the research and the analysis of the data. Reflexive practice will improve the process and product of qualitative research.References
1. Braun V, Clarke V. Successful Qualitative Research: A Practical Guide for Beginners. SAGE; 2013.
2. Miles MB, Huberman AM. Qualitative Data Analysis : An Expanded Sourcebook. 2nd ed. Sage; 1994.
3. Kleinheksel AJ, Rockich-Winston N, Tawfik H, Wyatt TR. Demystifying Content Analysis. Am J Pharm Educ. 2020;84(1):7113. doi:10.5688/ajpe7113
4. Glaser, B.G, Strauss, A. L. The Discovery of Grounded Theory: Strategies for Qualitative Research. Aldine; 1967.
5. Brown J, Addington-Hall J. How people with motor neurone disease talk about living with their illness: a narrative study. J Adv Nurs. 2008;62(2):200-208. doi:10.1111/j.1365-2648.2007.04588.x
6. Whiffin CJ, Bailey C, Ellis-Hill C, Jarrett N, Hutchinson PJ. Narratives of family transition during the first year post-head injury: perspectives of the non-injured members. Journal of advanced nursing. 2015;71(4):849-859. doi:10.1111/jan.12551
7. Saldana J. Fundamentals of Qualitative Research. Oxford University Press; 2011.
8. Silverman D. Interpreting Qualitative Data : A Guide to the Principles of Qualitative Research. 4th ed. SAGE; 2011.
9. Braun V, Clarke V. Using thematic analysis in psychology. Qualitative Research in Psychology. 2006;3(2):77-101. doi:10.1191/1478088706qp063oa
10. Braun V, Clarke V. Reflecting on reflexive thematic analysis. Qualitative Research in Sport, Exercise and Health. 2019;11(4):589-597. doi:10.1080/2159676x.2019.1628806
11. Smith JA, Flowers P, Larkin MH. Interpretative Phenomenological Analysis : Theory, Method and Research. SAGE; 2009.
12. Braun V, Clarke V. Thematic Analysis, a Practical Guide. SAGE; 2022.
13. Gale NK, Heath G, Cameron E, Rashid S, Redwood S. Using the framework method for the analysis of qualitative data in multi-disciplinary health research. BMC Med Res Methodol. 2013;13:117. doi:10.1186/1471-2288-13-117
14. Ritchie J, Spencer L. Qualitative data analysis for applied policy research. In: Bryman A, Burgess RG, eds. Analyzing Qualitative Data. Routledge; 1994.
15. M. Selveindran S, Samarutilake GDN, Vera DS, et al. Prevention of road traffic collisions and associated neurotrauma in Colombia: An exploratory qualitative study. Useche SA, ed. PLoS ONE. 2021;16(3):e0249004. doi:10.1371/journal.pone.0249004
16. Braun V, Clarke V, Weate P. Using thematic analysis in sport and exercise research. In: Smith B, Sparkes AC, eds. Routledge Handbook of Qualitative Research in Sport and Exercise. Taylor & Francis (Routledge); 2016.
17. Smith BG, Whiffin CJ, Esene IN, et al. Neurotrauma clinicians’ perspectives on the contextual challenges associated with traumatic brain injury follow up in low-income and middle-income countries: A reflexive thematic analysis. Landenmark H, ed. PLoS ONE. 2022;17(9):e0274922. doi:10.1371/journal.pone.0274922
18. Mason J. Qualitative Researching. 2nd ed. SAGE; 2002.
19. Horsburgh D. Evaluation of qualitative research. J Clin Nurs. 2003;12(2):307-312. doi:10.1046/j.1365-2702.2003.00683.x
20. Korstjens I, Moser A. Series: Practical guidance to qualitative research. Part 4: Trustworthiness and publishing. Eur J Gen Pract. 2018;24(1):120-124. doi:10.1080/13814788.2017.1375092
21. Ortlipp M. Keeping and Using Reflective Journals in the Qualitative Research Process. The Qualitative Report. 2008;13(4):695-705. doi:10.46743/2160-3715/2008.1579
22. Bolton G. Reflective Practice : Writing and Professional Development. 3rd ed. SAGE; 2010.